TDS-C01 Online Practice Questions and Answers
Which two types of data are represented as dimensions in Tableau Desktop? (Choose two.)
A. Names of people such as students, customers, and so on
B. Numerical totals such as test scores, sales and profit totals, and so on
C. Names of regions such as East, West, and so on
D. Tableau-generated latitude and longitude coordinates
You create the following visualization.
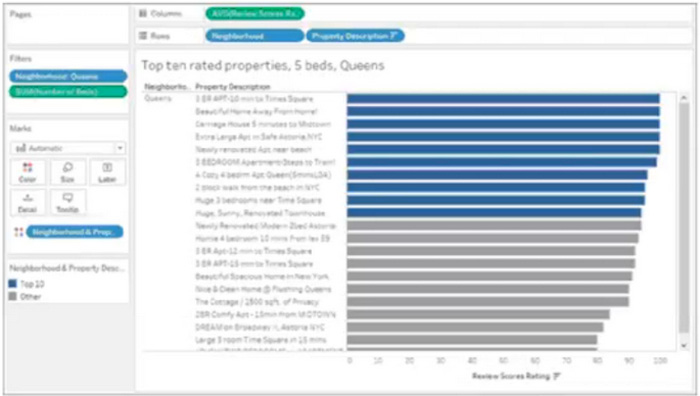
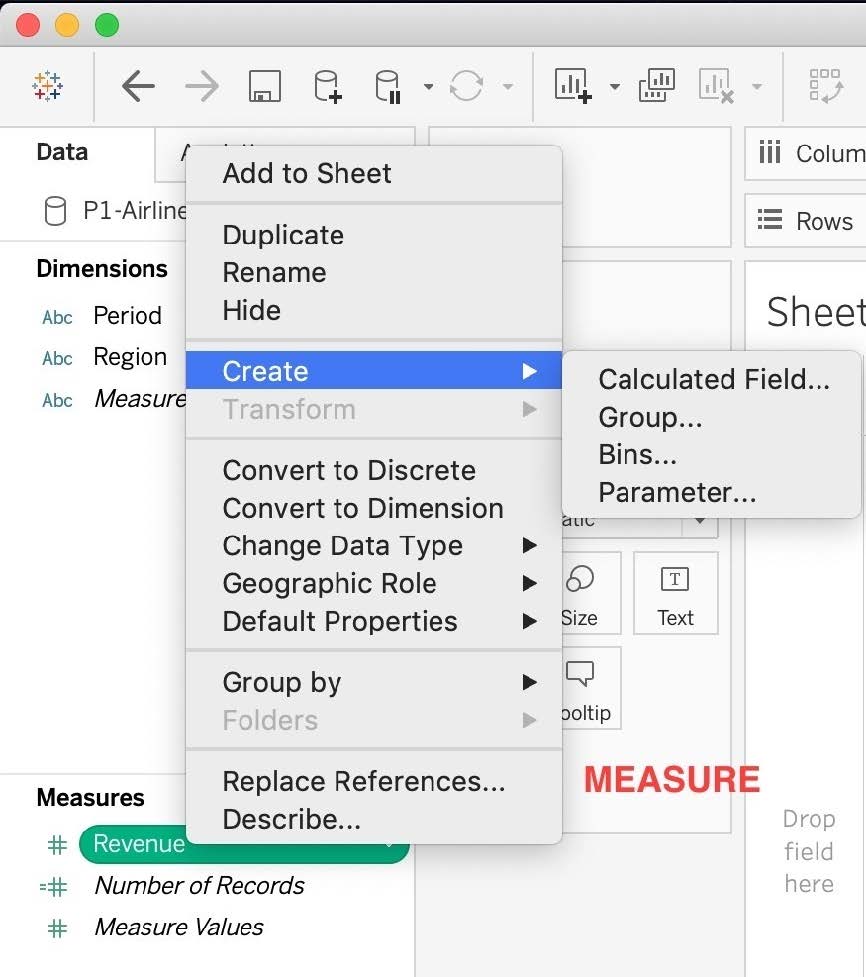
What is the first step to create the visual grouping of the 10 marks shown in blue?
A. Select the desired 10 marks in the view
B. Select the desired 10 text labels under Property Description
C. Create a Group on the Property Description field in the Data pane
D. Create a Set on the Neighborhood field in the Data pane
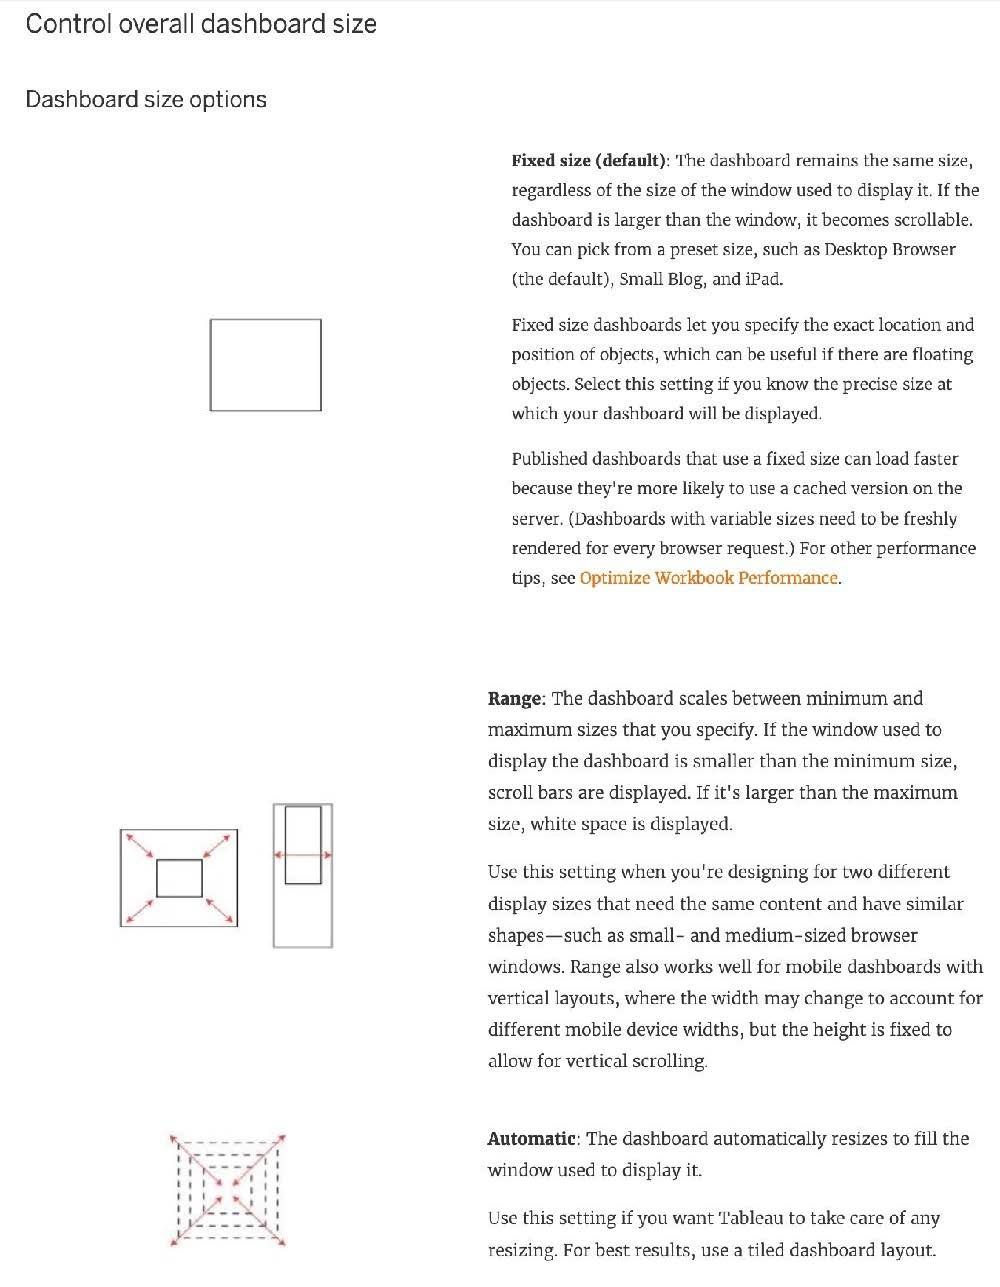
Which of the following are valid Dashboard size options?
A. Range
B. Fixed Size
C. Automatic
D. Scaled
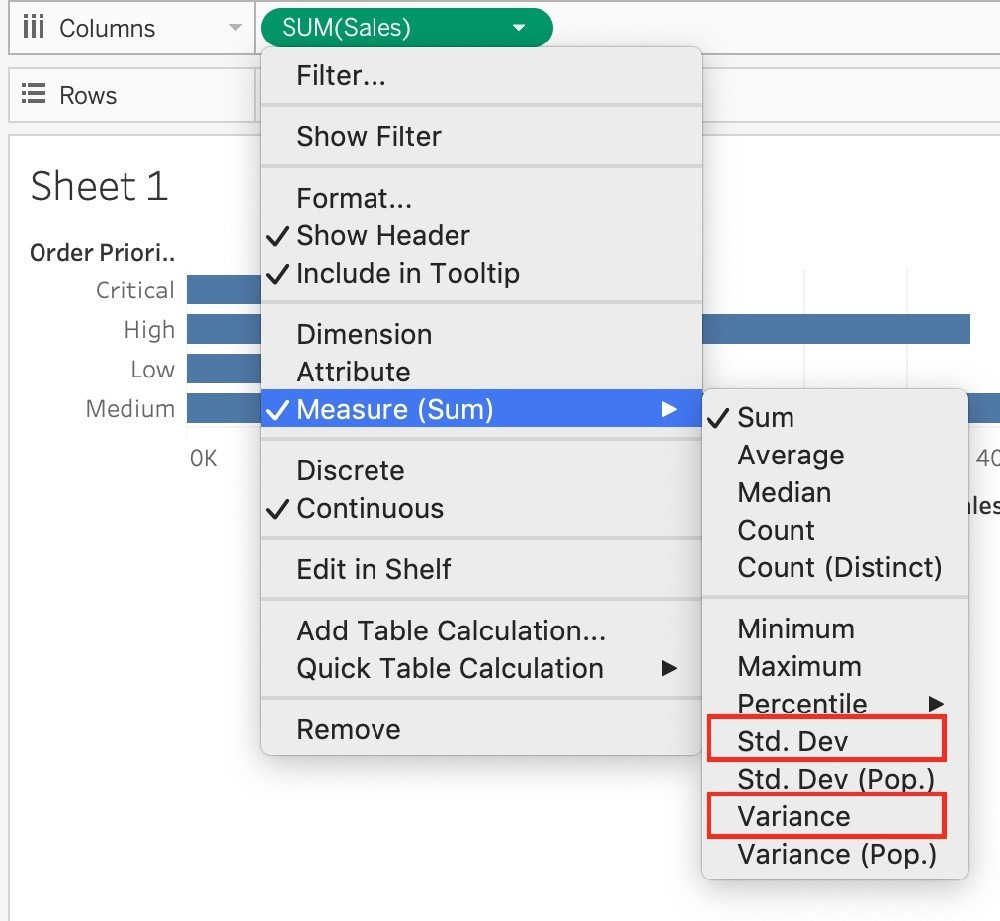
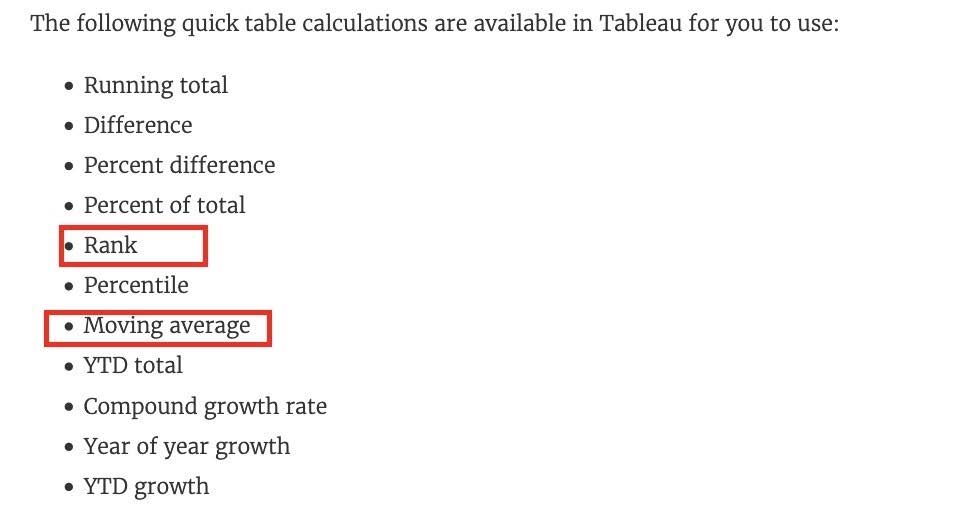
Which of the following calculations DO NOT need a quick table calculation?
A. Variance
B. Rank
C. Moving Average
D. Standard Deviation
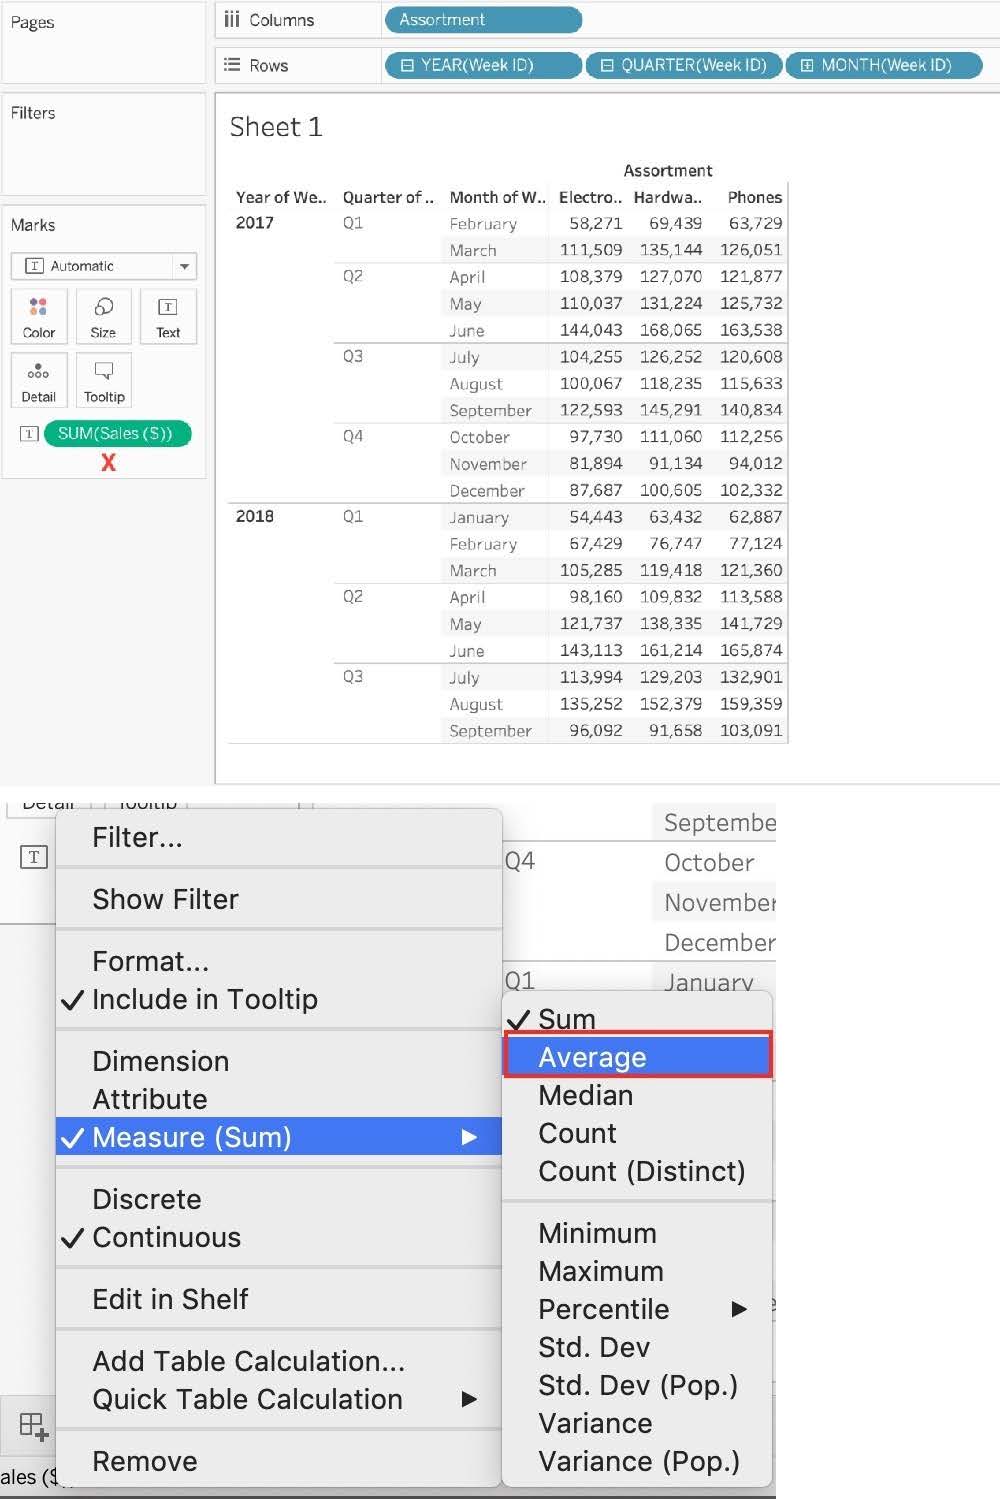
Using the Time Series table, create a cross-tab showing sales for each Assortment broken down by Year and Quarter. In Q4 of October 2017, what was the Average sales amount for the Hardware assortment?
A. 111,060
B. 1,461
C. 112,256
D. 1,222
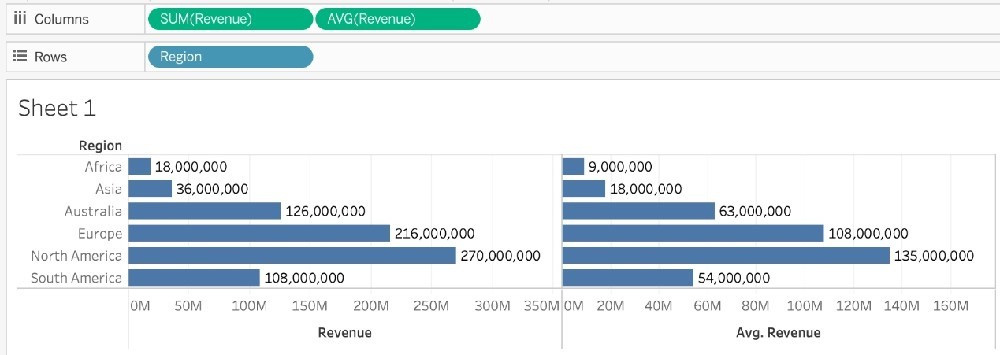
Is it possible to use measures in the same view multiple times (e.g. SUM of the measure and AVG of the measure)?
A. Yes
B. No
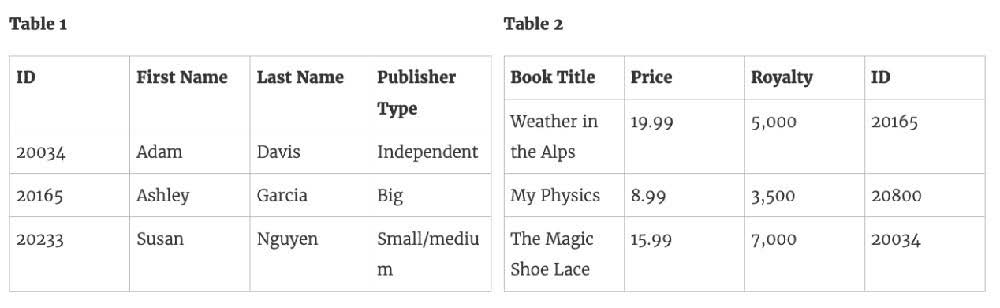
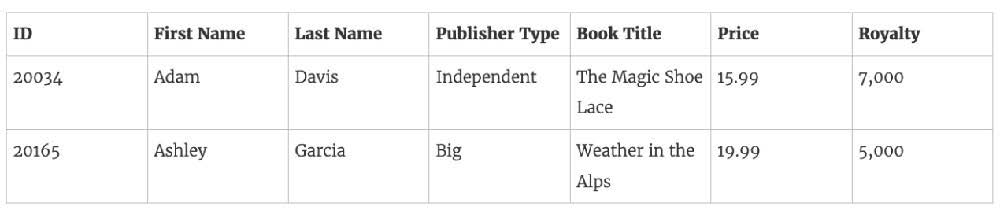
Which of the following would you use to connect to multiple tables in a single data source at once?
A. A Blend
B. A Hierarchy
C. A Set
D. A Join
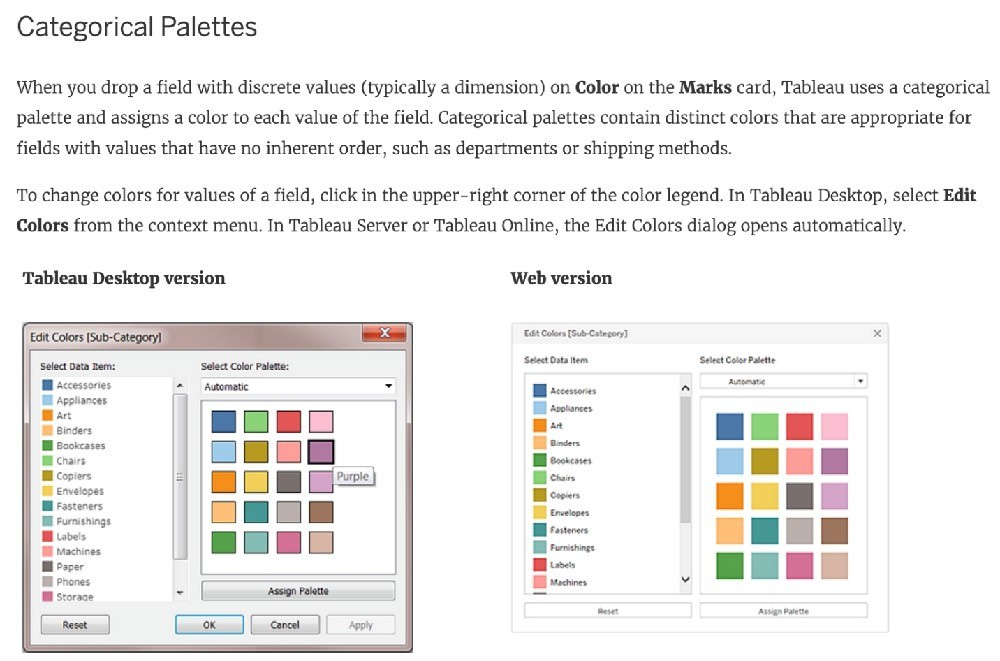
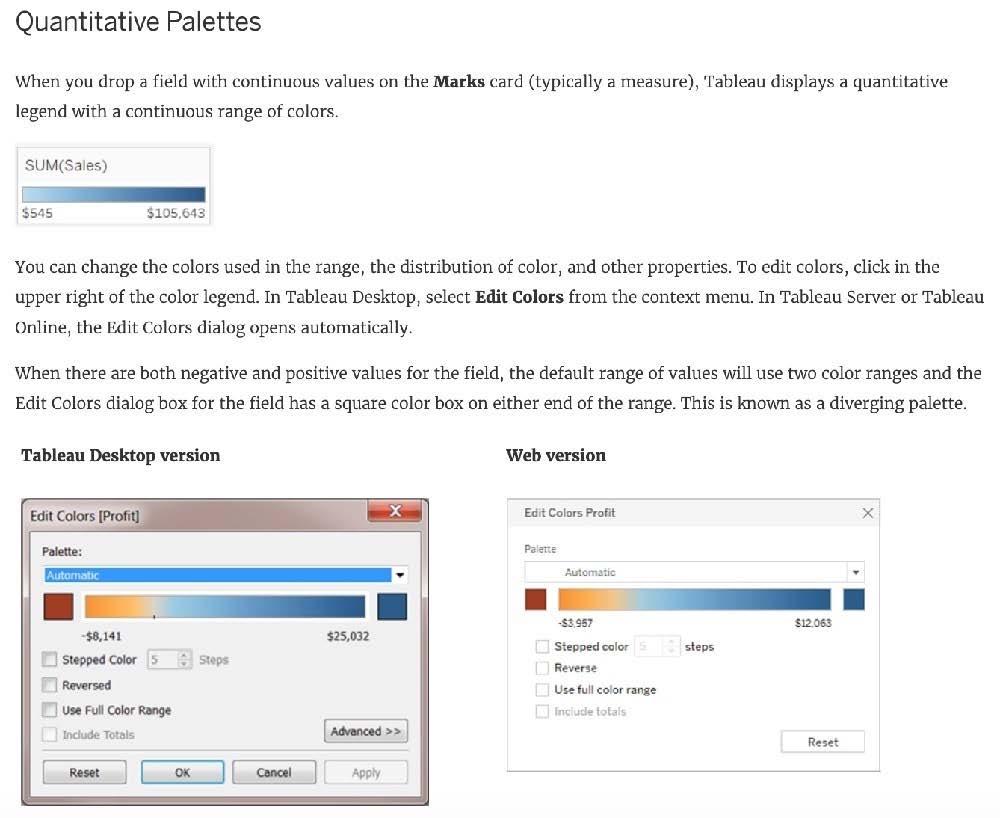
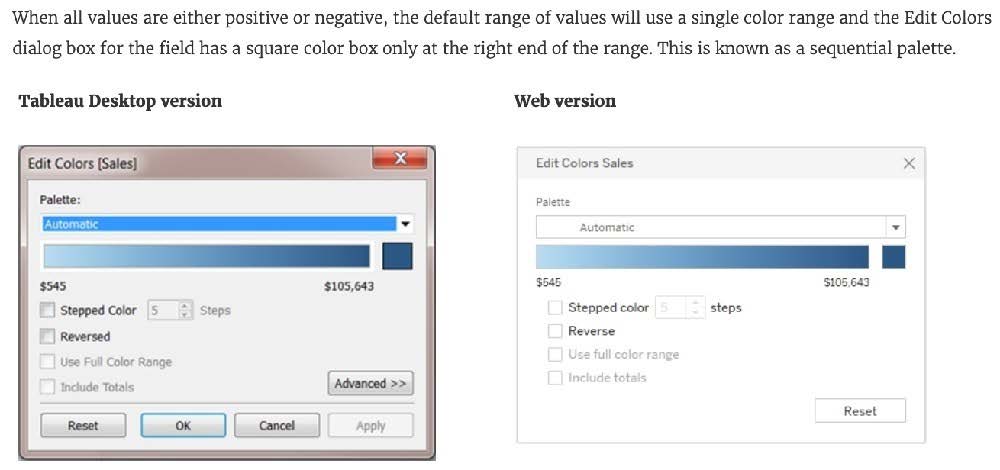
True or False: We get different colour pallete options if we drop a discrete field on "Color" in the marks card compared to if we drop a continous field on Color.
A. False
B. True
Join the Geo Data and Time Series Table on the Item Number ID column, and display the Store count for every State on a Map. What was the Store count in 2017 for Texas (TX)?
A. 592,593
B. 293,202
C. 416,702
D. 336,908

Home | Contact Us | About Us | FAQ | Guarantee & Policy | Privacy & Policy | Terms & Conditions | How to buy
Copyright © 2026 pass4itsure.com. All Rights Reserved