TDA-C01 Online Practice Questions and Answers
You want to connect a Tableau workbook to a dataset in a Microsoft Excel spreadsheet. What should you do from Tableau Desktop?
A. From the Data menu select New Data Source
B. From the Data menu select Replace Data Source
C. From the File menu select Import Workbook
D. From the File menu select New
You have the Mowing dashboard.

Which two elements are floating? Choose two.
A. The state filter
B. The color legend C. The map
D. The Rate of Obesity chart
E. The little
You have the following dashboard.
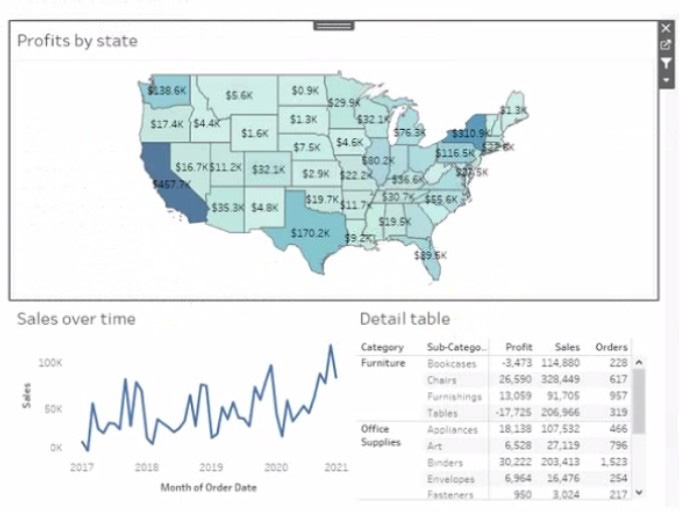
Currently the map is used as a filter that affects the data on the otter sheets of the dashboard
You need to configure the dashboard to ensure that selecting a data point on the map only tillers the Detail table
What should you do?
A. From the context menu of Sales over time select Ignore Actions
B. From the context menu of Sales over lime select Remove Dashboard Item
C. From the context menu of Profits by Stale deselect Use as Filter
D. From the context menu of Sales over time select Deselect
You have the following chart that shows profits and discounts over time.
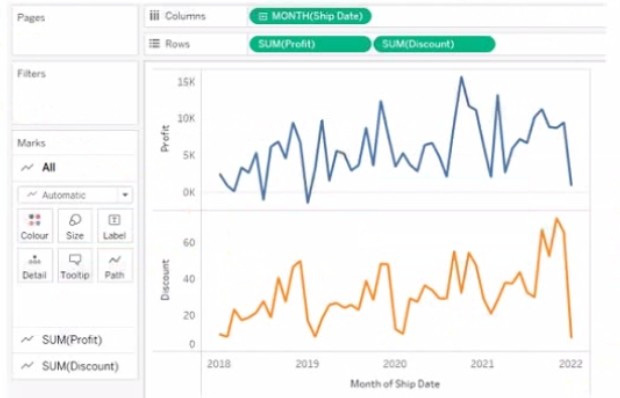
You need to combine the lines to appear as shown in the following chart.
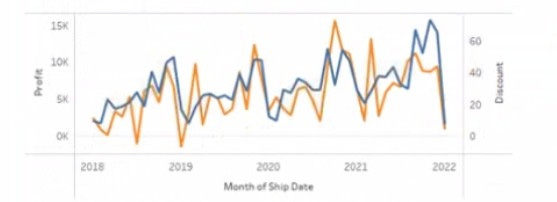
What should you do?
A. Drag Discount to Color on the Marks card
B. Convert Discount to Discrete C. Set Discount to Dual Axis
D. Drag Discount to the Columns shelf
You have the following chart that shows the cumulative of sales from various dates.
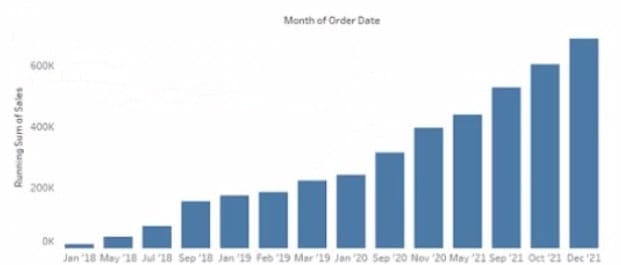
You want the months to appear as shown in the following chart.
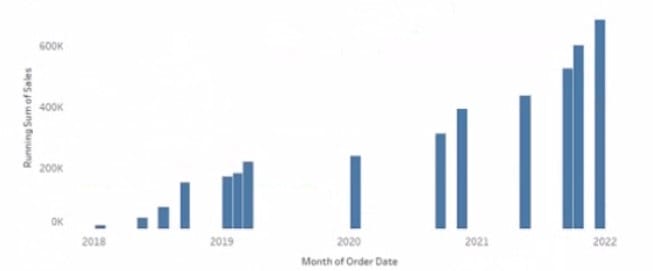
What should you do?
A. Convert the date to Exact Date
B. Convert the date to Continuous
C. Select Show Misting Values for the dale
D. Convert the date to Attribute
You need to change the values of a dimension without creating a new field. What should you do?
A. Rename the fields
B. Create aliases
C. Create groups
D. Transforms the fields
You have a Tableau workbook.
You want to make the workbook available in Tableau Online.
What should you do?
A. From the Server menu, select Tableau Public, and then select Save to Tableau Public.
B. From the File menu, select Export Packaged Workbook.
C. From the Server menu, select Publish Data Source.
D. From the Server menu, select Publish Workbook.
CORRECT TEXT
Open the link to Book1 found on the desktop. Open the sales dashboard.
Add the Sales by State sheet in a Show/Hide button to the right side of the dashboard.
A. Check the steps below in explanation.
CORRECT TEXT
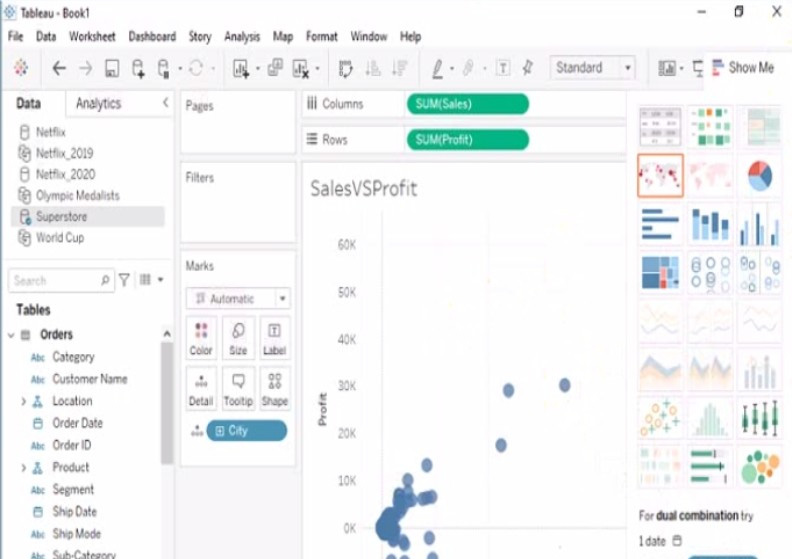
Open the link to Book1 found on the desktop. Open SalesVSProfit worksheet.
Add a distribution band on Profit to show the standard deviation from- 1 to 1.
A. Check the steps below in explanation.
CORRECT TEXT
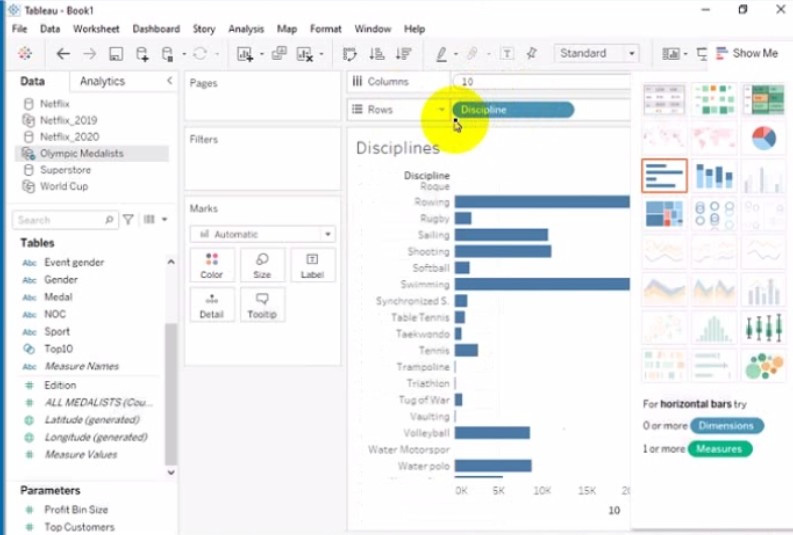
Open the link to Book1 found on the desktop. Open Disciplines worksheet.
Filter the table to show the members of the Top10 set and the members of the Bottom10 set. There should be a total of 20 rows.
A. Check the steps below in explanation.

Home | Contact Us | About Us | FAQ | Guarantee & Policy | Privacy & Policy | Terms & Conditions | How to buy
Copyright © 2026 pass4itsure.com. All Rights Reserved