QSBA2018 Online Practice Questions and Answers
A bus company wants to analyze customer travel patterns to add additional services or create new routes.
The business analyst needs to consider the following data: 190 routes across the city Start and end location of each route Volume of customers travelling per hour Customer complaints when buses are full
Which visualization should a business analyst use to meet this requirement?
A. Area layer map
B. Treemap
C. Line layer map
D. Scatter plot
A business analyst is creating a dashboard to analyze supply chains. The app must contain several elements: A bar chart that shows a number of products and product groups handled by shipper A map that shows the number of shipments sent from factory locations A bar chart that shows average delivery costs by shipper
Which dimensions should the business analyst use for this app?
A. Product, Shipper, FactoryLocation
B. Shipper, FactoryLocation
C. Shipper, Product
D. Product, ProductGroup, Shipper
A business analyst uses the data manager to load customer data from a QVD file. The data manager automatically profiles the data, and recognizes City and Country values as Geo data.
The app must meet the following requirements: Country field should be in Geo data format City should NOT be allowed as a mapping option for the users There must be an association between the Country and City fields
Which actions should the business analyst take to meet these requirements?
A. 1. In the Associations view, select the City field
2. Delete $geoname-tag from field properties
B. 1. In the Associations view, select the City field
2. Change the format from `Geo data' to `No data profiling'
C. 1. In the Associations view, select the City field
2. Delete the City field
D. 1. In the Associations view, select the City field
2. Change the format from `Geo data' to `General'
A business analyst is NOT familiar with the data and is using insight advisor to create a number of visualizations.
Which steps should the business analyst take to add the visualizations to a sheet?
A. Click Generate insights to find visualizations, then click Add to sheet
B. Use the selection tool to find visualizations, then click Add to sheet
C. Use smart search to find visualizations, then click Add to sheet
D. Drag and drop fields on the workspace, then click Add to sheet
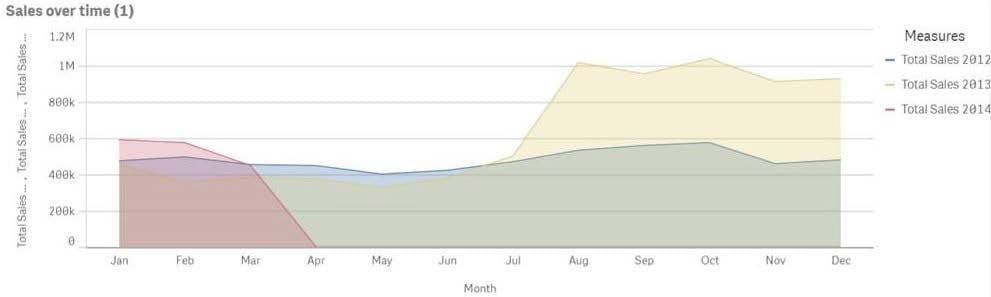
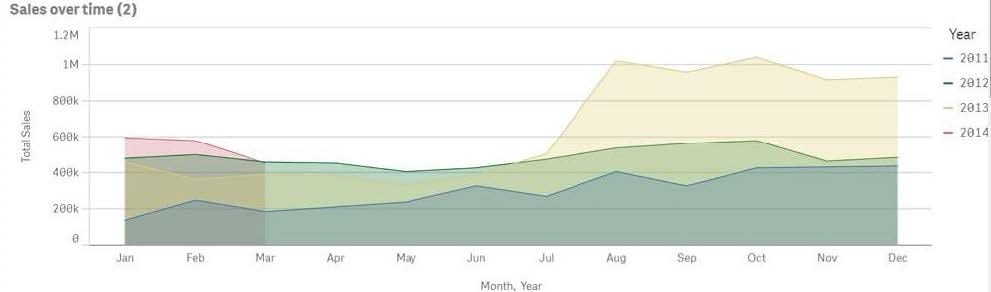
Refer to the exhibits.
A business analyst must improve the first chart shown to make it look like the second chart.
Which two actions should the business analyst take to meet this requirements? (Choose two.)
A. Replace the three measures with one measure that calculated Total Sales
B. Change the stacked chart property in the properties panel
C. Add Year as an additional dimension
D. Change the continuous chart property in the properties panel
E. Change the Area property in the chart properties
A hospital billing department is concerned with the performance of the cardiology and orthopedic departments. The billing department wants to add a visualization to an existing app to analyze billing for these two departments.
The business analyst must consider the hierarchy of: The department The physicians in each department The procedure performed by the physicians
What should the business analyst create to meet the requirements?
A. A scatter plot using alternate dimensions A bookmark for the physician
B. A bar chart with a cyclic group A bookmark for the physician
C. A bar chart using master items drill-down A bookmark for the departments
D. A scatter plot using set analysis A bookmark for the departments
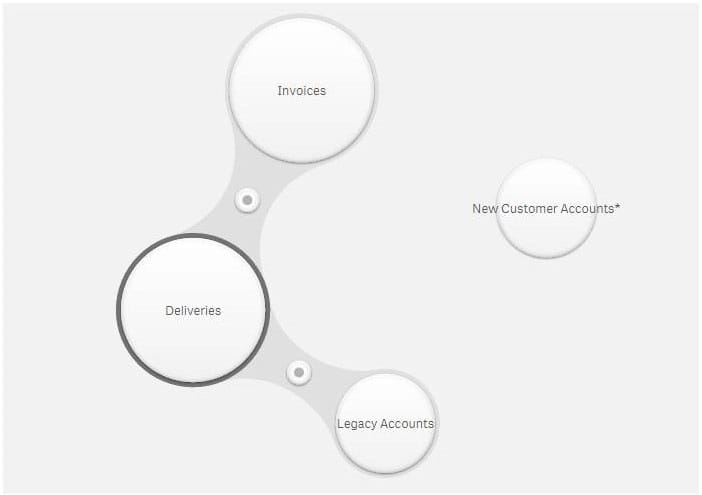
Refer to the exhibit.
A company is starting to use a new customer account system. The business analyst must include this data in an existing app.
Data from the legacy customer account system is already available in the app.
Both tables have similar data, but the columns have different names.
Which actions should the business analyst take to merge data from both systems?
A. 1. Select Legacy Accounts
2.
Click Concatenate tables
3.
Select New Customer Accounts
4.
Map the tables
5.
Click Apply
B. 1. Select New Customer Accounts
2.
Drag it over Invoices
3.
Define the association
4.
Click Apply
C. 1. Select Legacy Accounts
2.
Click Concatenate tables
3.
Select New Customer Accounts
4.
Click Sample data
5.
Click Apply
D. 1. Select New Customer Accounts
2.
Drag it over Legacy Accounts
3.
Rename the association
4.
Click Apply
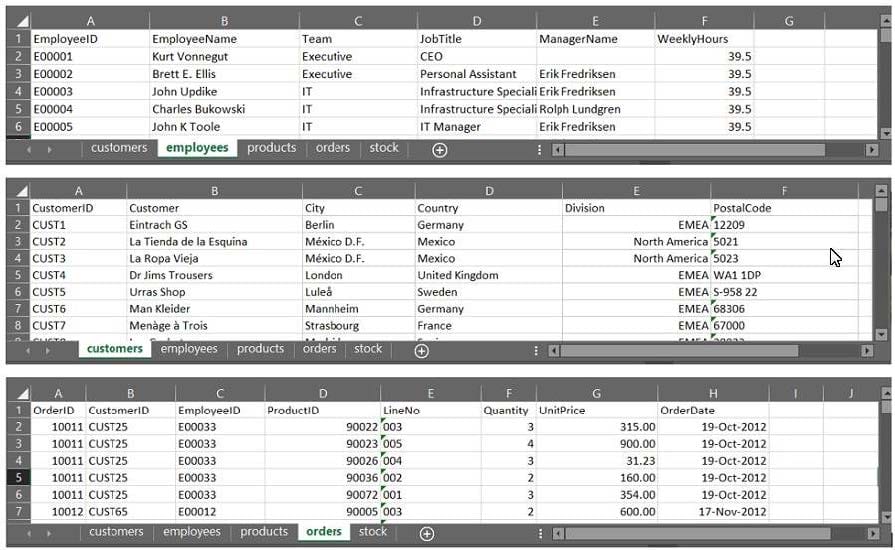
Refer to the exhibit.
A business analyst must provide a visualization to show the trends of the number of orders generated per
employee. The Customer must be searchable.
EmployeeID, EmployeeName, OrderID, and CustomerID will be included in the load.
Which additional fields must be loaded to meet this requirement?
A. OrderDate, Customer, ProductID
B. Customer, ProductID
C. OrderDate, Customer
D. OrderDate, UnitPrice
A CEO of an automotive manufacturing company wants a single dashboard sheet to track the company's sales.
The app must meet several requirements: All charts must be on one sheet Show summary charts of key performance data Ability to scroll up and down the sheet
Which set of actions should the business analyst use to meet these requirement?
A. Use KPI objects Use Insight Advisor
B. Adjust grid spacing Use Insight Advisor
C. Use KPI objects Activate Chart assistance
D. Activate grid spacing Activate Extend sheet
Which two features/functions are enabled by the Qlik Associative Engine?
A. Smart search and mashups
B. Insight advisor and smart search
C. Insight advisor and data profiling
D. Smart search and data profiling

Home | Contact Us | About Us | FAQ | Guarantee & Policy | Privacy & Policy | Terms & Conditions | How to buy
Copyright © 2025 pass4itsure.com. All Rights Reserved