PL-300 Online Practice Questions and Answers
You need to create the On-Time Shipping report. The report must include a visualization that shows the percentage of late orders. Which type of visualization should you create?
A. bar chart
B. scatterplot
C. pie chart
You have multiple dashboards.
You need to ensure that when users browse the available dashboards from powerbi.com, they can see which dashboards contain Personally Identifiable Information (PII). The solution must minimize configuration effort and impact on the dashboard design.
What should you use?
A. comments
B. tiles
C. Microsoft Information Protection sensitivity labels
D. Active Directory groups
Note: This question is part of a series of questions that present the same scenario. Each question in the series contains a unique solution that might meet the stated goals. Some question sets might have more than one correct solution, while
others might not have a correct solution.
After you answer a question in this scenario, you will NOT be able to return to it. As a result, these questions will not appear in the review screen.
You have a clustered bar chart that contains a measure named Salary as the value and a field named Employee as the axis. Salary is present in the data as numerical amount representing US dollars.
You need to create a reference line to show which employees are above the median salary.
Solution: You create an average line by using the Salary measure.
Does this meet the goal?
A. Yes
B. No
HOTSPOT You are using Power Bi Desktop to connect to an Azure SQL database The connection is configured as shown in the following exhibit.
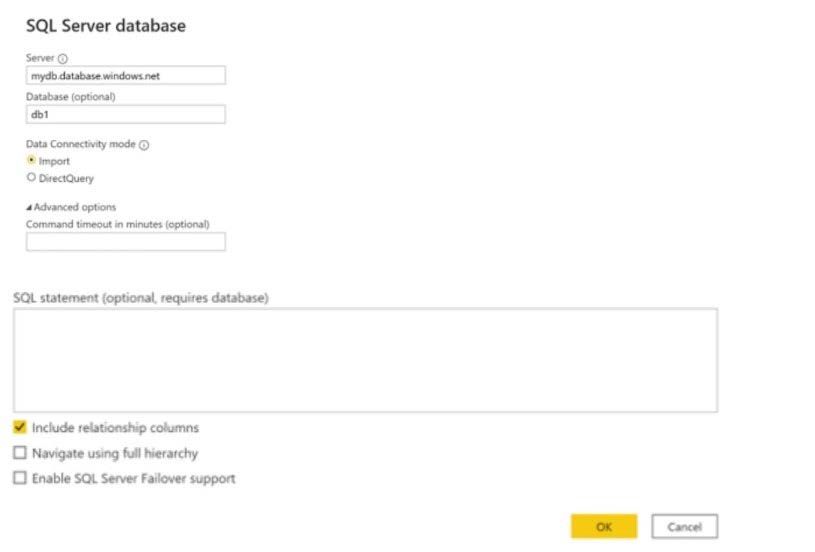
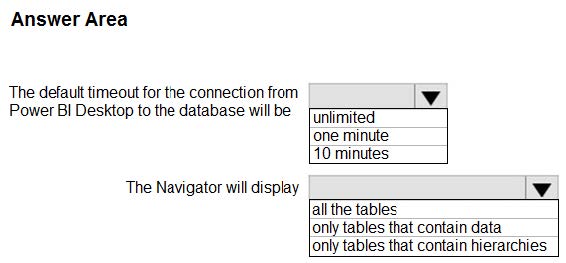
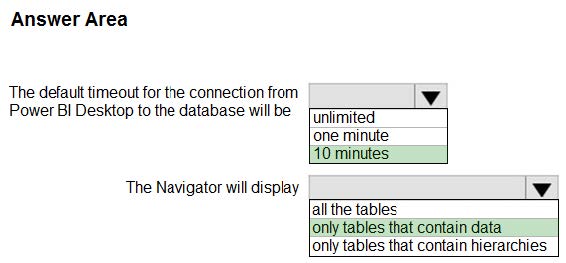
Use the drop-down menus to select the answer choice that completes each statement based on the information presented in the graphic NOTE: Each correct solution is worth one point
Hot Area:
HOTSPOT
You have a Power Bl report.
You have the following tables.
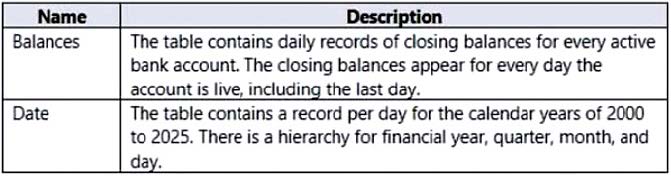
You have the following DAX measure.
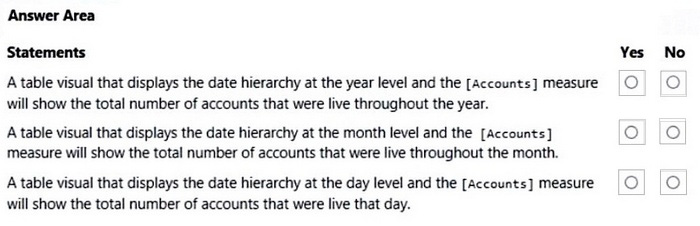
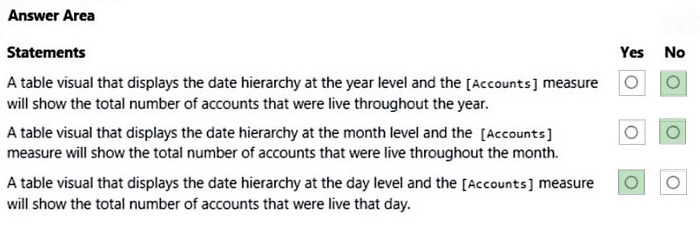
Accounts :=
CALCULATE (
DISTINCTCOUNT (Balances[AccountID]),
LASTDATE ('Date'[Date])
For each of the following statements, select Yes if the statement is true. Otherwise, select No.
NOTE: Each correct selection is worth one point.
Hot Area:
HOTSPOT
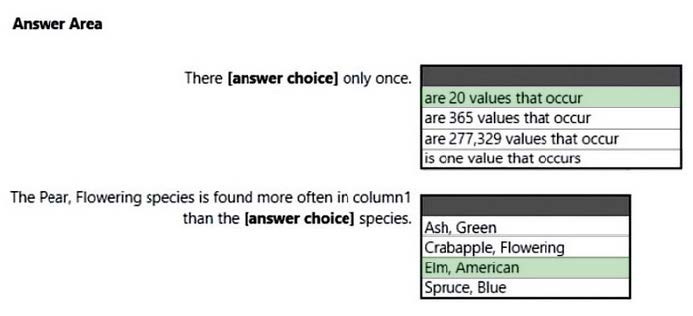
You are profiling data by using Power Query Editor.
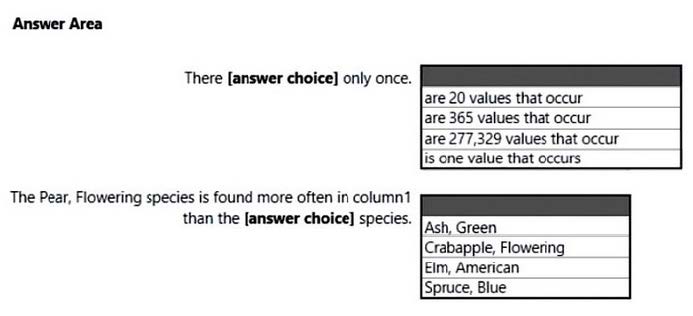
You have a table that contains a column named column1. Column statistics and Value distribution for column1 are shown in the following exhibit.
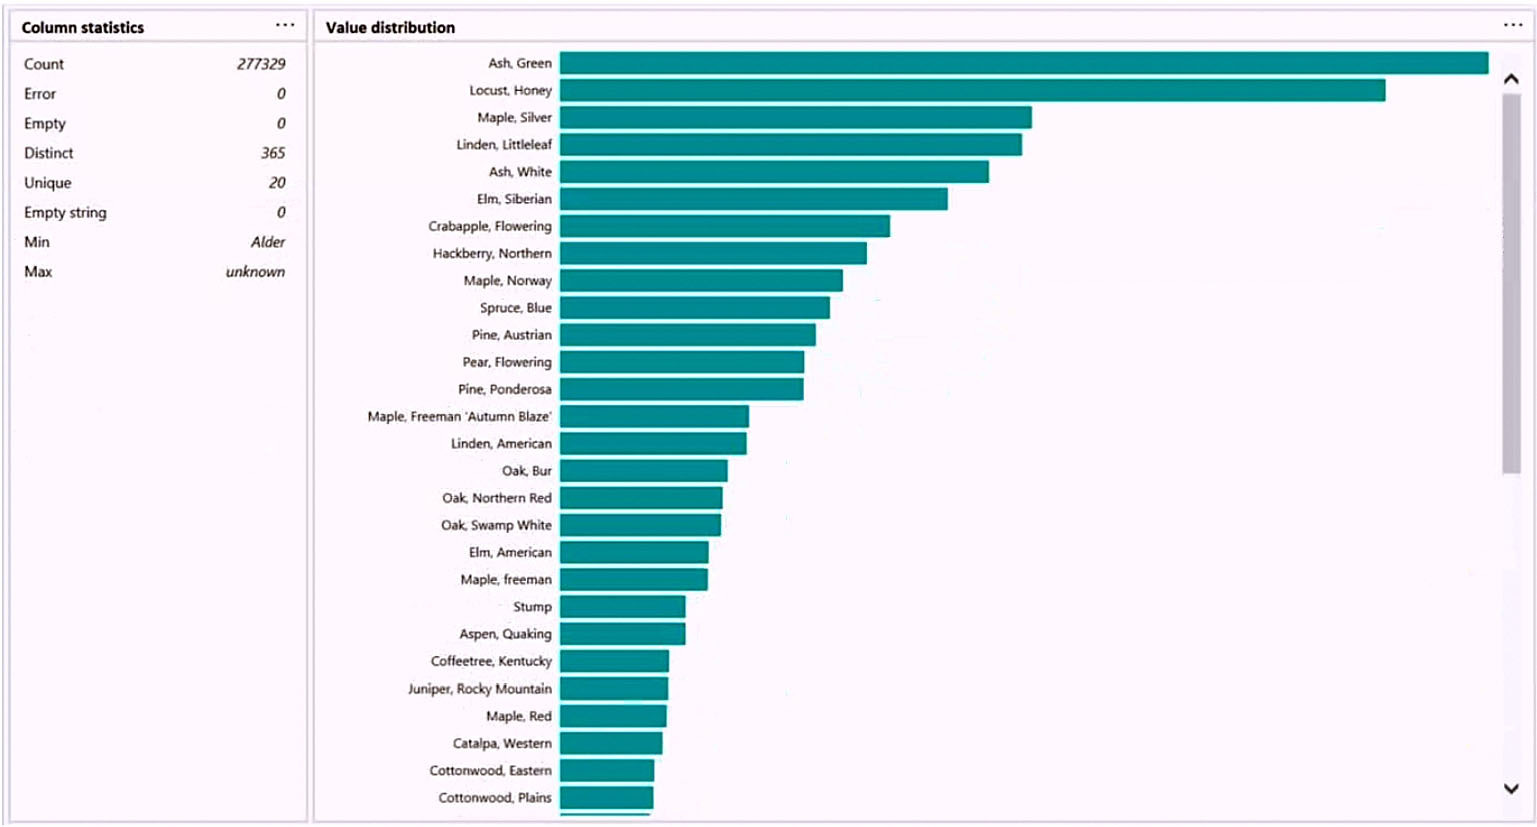
Use the drop-down menus to select the answer choice that completes each statement based on the information presented in the graphic. NOTE: Each correct selection is worth one point.
Hot Area:
HOTSPOT
The table has the following columns.
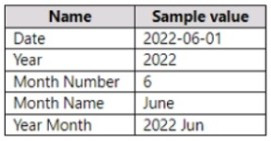
You need to add a column that will be used to sort the Year Month column chronologically.
Hot Area:


HOTSPOT
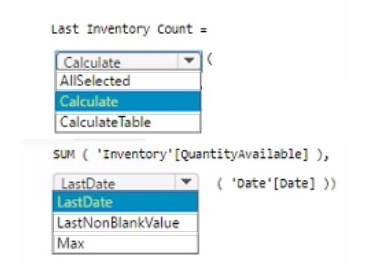
You are creating a Power 81 model to analyze inventory.
You load data into three tables named Date Product, and Inventor/. The Inventor/ table relates to the Date and Product tables by using one-to-many relationships.
Inventor)' data is recorded daily with no exceptions. The correct inventory quantity for a given product in a month is the last recorded value for that month
You need to write a DAX measure that will show the correct inventory value when a user analyzes inventory by year, month, or date.
How should you complete the measure? To answer select the appropriate options in the answer area.
NOTE: Each correct selection is worth one point
Hot Area:

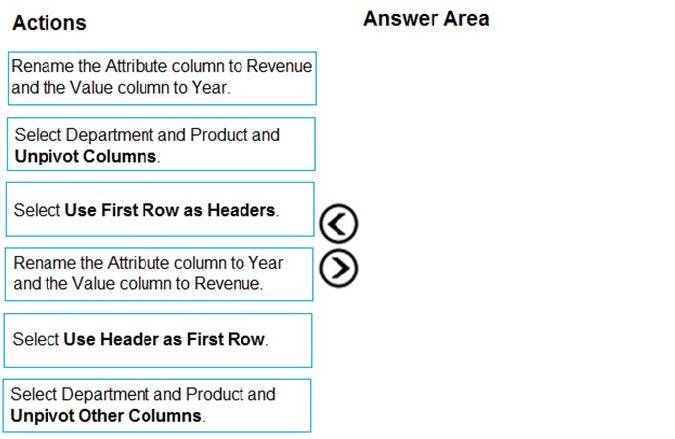
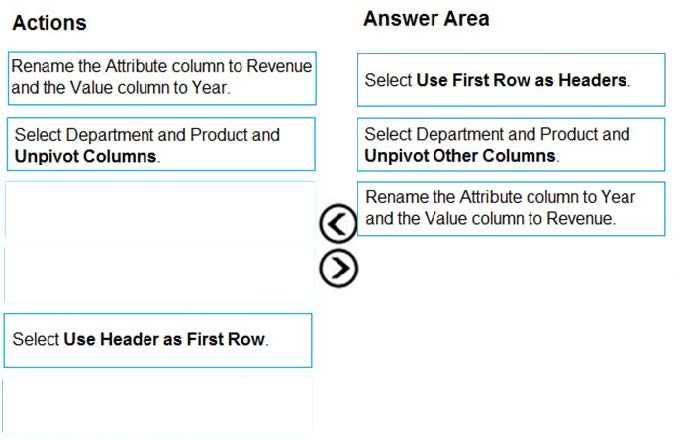
DRAG DROP
You receive revenue data that must be included in Microsoft Power BI reports.
You preview the data from a Microsoft Excel source in Power Query as shown in the following exhibit.
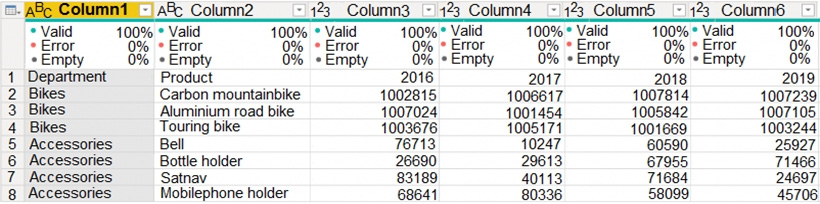
You plan to create several visuals from the data, including a visual that shows revenue split by year and product.
You need to transform the data to ensure that you can build the visuals. The solution must ensure that the columns are named appropriately for the data that they contain.
Which three actions should you perform in sequence? To answer, move the appropriate actions from the list of actions to the answer area and arrange them in the correct order.
Select and Place:
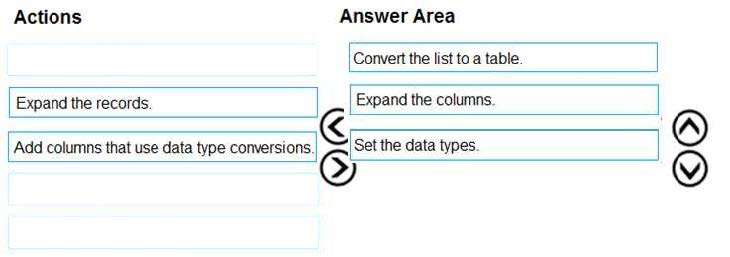
DRAG DROP
You are building a dataset from a JSON file that contains an array of documents.
You need to import attributes as columns from all the documents in the JSON file. The solution must ensure that date attributes can be used as date hierarchies in Microsoft Power BI reports.
Which three actions should you perform in sequence? To answer, move the appropriate actions from the list of actions to the answer area and arrange them in the correct order.
Select and Place:

Home | Contact Us | About Us | FAQ | Guarantee & Policy | Privacy & Policy | Terms & Conditions | How to buy
Copyright © 2026 pass4itsure.com. All Rights Reserved