LOOKER-BUSINESS-ANALYST Online Practice Questions and Answers
An analyst needs to compare monthly sales, year over year, based on when an order was created, as shown in the exhibit.
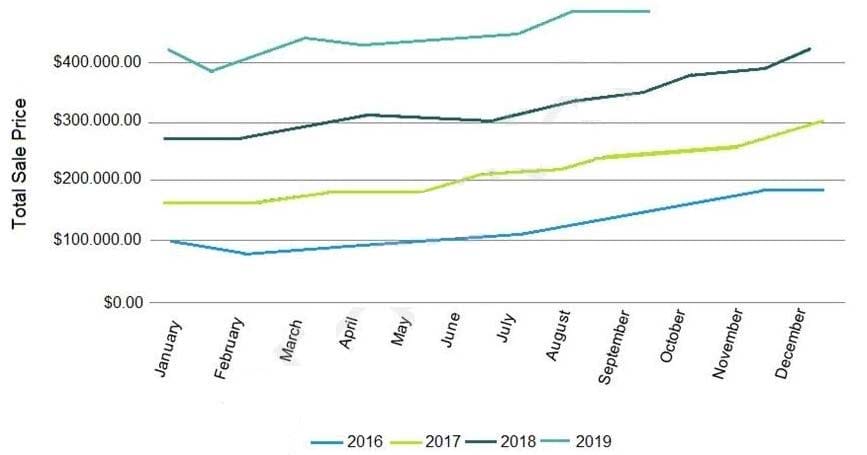
How should the analyst, in addition to selecting the measure Total Sales build the report?
A. Select the dimension Created Month, and pivot on the dimension Created Year.
B. Select the dimension Created Year, and pivot on the dimension Created Month.
C. Select the dimension Created Month Name, and pivot on the dimension Created Year.
D. Select the dimension Created Year, and pivot on the dimension Created Month Name.
An analyst needs to send a Look to an external client in CSV format. When the data is being downloaded, the Limit section has the option to select All Results grayed out, with text reading "All Results Unavailable."
What are three causes of this message? (Choose three.)
A. The Row Limit chosen in the Look is too high.
B. There is a table calculation in the Look.
C. Unlimited results are unsupported by CSV format.
D. The Row Totals option is turned on in the Look.
E. There is a Running Total measure in the Look.
F. The Totals option is turned on in the Look.
An analyst needs to display data from two different sources together. There is a Look for each data source, but there is no shared field that can be combined. Both Looks are saved in the Shared folder.
How should the analyst display the data from both sources?
A. use Merged Results to combine the data sources.
B. Ask the LookML developer to build a new Explore.
C. Add both Looks to a dashboard
D. Pin both Looks to a board.
An analyst has created a line chart with Value Labels enabled, but the values are too long and need to be abbreviated.
Which visualization option should the analyst utilize to alter the display of the value labels?
A. Axis Value Labels
B. Value Format
C. Label Rotation
D. Time Label Format
A business analyst is building a report of predicted sales. The business analyst wants to filter the results to only show dates in the next seven days. This filter should work whenever the results are generated.
Which filter expression should the business analyst use?
A. 7 days from now
B. After Today's Date for 7 days
C. Today for 7 days
D. For 7 days
An analyst at a banana quality assurance firm needs to compare performance week over week to make sure the firm stays on track. The analyst needs to show two metrics:
1.
Number of bananas cleared for consumption the previous week
2.
Number of bananas cleared for consumption the week before that Which process should the analyst follow to show these two metrics in a report?
A. Create two tiles on a dashboard and two dashboard filters. Apply a different filter to each tile ("last week" and "2 weeks ago" respectively)
B. Create one tile on a dashboard and two dashboard filters ("last week" and "2 weeks ago" respectively). Apply both dashboard filters to the tile.
C. Create two tiles on a dashboard. In the Edit mode of one tile, add a filter for "last week". Add a dashboard filter for "2weeks ago" and apply it to the other tile.
D. Create two identical looks in the same folder. Add filters on them for "last week" and "2 weeks ago" respectively.
The query below shows how many uses purchased an item from each of two clothing departments.

Why are the total and sum of the rows unequal?
A. There is a filter limiting the count in the Total row.
B. There is a faulty logic in the way users relate to clothing departments.
C. A user is only counted once in the total even if the user has purchased from both departments.
D. There are users who have never purchased a clothing item from either department.
An analyst has a dashboard with table visualizations that display the first few results, and the user can scroll down to see the remaining results. The analyst wants to download a PDF of the dashboard.
How should the analyst ensure that the PDF shows all available results in the UI dashboard?
A. Select the Expand Tables option.
B. Select the All Results option
C. Select the Allow Scroll option and specify each table.
D. Select the Paper Size option and specify a large size.
The sales team has all its Looker content stored in a folder called Sales. Team members are complaining that the Looks and dashboards have been getting moved and edited in unwanted ways. Only the sales analyst should be editing the content in the Sales folder.
Which access settings should be applied to the folder?
A. Admins: Manage Access, Edit Sales analyst: Edit Sales group: View
B. Admins: View Sales analyst: Edit Sales group: View
C. Admins: View Sales analyst: Manage Access, Edit Sales group: View
D. Admins: Manage Access, Edit Sales analyst: Manage Access, Edit Sales group: View
An analyst works on the data team at an organization that maintains multiple similar Explores. The analyst has access to see every Explore, but knows that employees in the finance department only have access to explores tagged Finance.
There is an Employee Compensation Data Finance Explore that the finance department has access to. The analyst usually uses an All Employee Data Explore that also includes personally identifiable information.
What should the analyst do to ensure proper access if the analyst wants to send an example visualization to the finance team?
A. Create Merged Results with the Employee Compensation Data Finance Explore and the All Employee Data Explore, and send the URL of the Merged Results.
B. Use the Employee Compensation Data Finance Explore and send the URL of the Explore to the finance team.
C. Use the All Employee Data Explore, but use Looker's built-in Send functionality to email the visualization.
D. Use the All Employee Data Explore, add a filter to exclude personally identifiable information, and send the URL of the Explore to the finance team.

Home | Contact Us | About Us | FAQ | Guarantee & Policy | Privacy & Policy | Terms & Conditions | How to buy
Copyright © 2026 pass4itsure.com. All Rights Reserved