ICGB Online Practice Questions and Answers
The Regression Model for an observed value of Y contains the term which represents the Y axis intercept when X = 0.
A. True
B. False
__________ Distributions occur when data comes from several sources that are supposed to be the same yet are not.
A. Skewed
B. Bimodal
C. Gaussian
D. Tri-peaked
When constructing a Fishbone Diagram using the ________ approach is the most classic arrangement.
A. 6M
B. 4M
C. 5M
D. Alphabetical
The 5 Why Analysis is only useful if the possible independent variable can be broken down into five possible causes.
A. True
B. False
Which of these is Discrete data?
A. Train arrived at 4:17 pm.
B. Race car consumed 23 gallons of fuel.
C. Of the 42 people on the bus, 12 went into the station.
D. It took 3 hours and 32 minutes to complete the marathon.
Process Capability is a function of which of these?
A. Customer requirements
B. Process performance
C. Output over time
D. All of these answers are correct
This output is what type of advanced Capability Analysis?
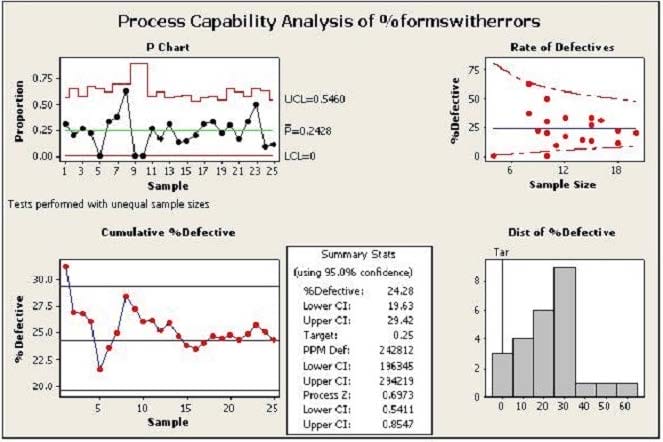
A. Continuous
B. Binomial
C. Poisson
D. Discreet
E. DPU
SPC charts typically have the most recent data point on the right hand side.
A. True
B. False
Which of these statements describe an undesirable situation when implementing SPC? (Note: There are 2 correct answers).
A. The lower Control Limit for the R chart is equal to zero
B. The Control Limits are wider than the customer specification limits
C. A process is in Statistical Control before implementation of SPC
D. Attempt to use SPC for tracking transaction times at a warehouse
E. Indication of the specification limits on the Control Chart
If the data displayed in a Histogram displays two peaks the distribution would likely be _____________.
A. Transformed
B. Multi-skewed
C. Bi-attribute
D. Bimodal

Home | Contact Us | About Us | FAQ | Guarantee & Policy | Privacy & Policy | Terms & Conditions | How to buy
Copyright © 2026 pass4itsure.com. All Rights Reserved