E20-026 Online Practice Questions and Answers
Your company has 3 different sales teams. Each team's sales manager has developed incentive offers to increase the size of each sales transaction. Any sales manager whose incentive program can be shown to increase the size of the average sales transaction will receive a bonus. Data are available for the number and average sale amount for transactions offering one of the incentives as well as transactions offering no incentive. The VP of Sales has asked you to determine analytically if any of the incentive programs has resulted in a demonstrable increase in the average sale amount. Which analytical technique would be appropriate in this situation?
A. One-way ANOVA
B. Multi-way ANOVA
C. Student's t-test
D. Wilcoxson Rank Sum Test
In R, functions like plot() and hist() are known as what?
A. generic functions
B. virtual methods
C. virtual functions
D. generic methods
In which phase of the data analytics lifecycle do Data Scientists spend the most time in a project?
A. Discovery
B. Data Preparation
C. Model Building
D. Communicate Results
Data visualization is used in the final presentation of an analytics project. For what else is this technique commonly used?
A. Data exploration
B. Descriptive statistics
C. ETLT
D. Model selection
Which word or phrase completes the statement?
Theater actor is to "Artistic and Expressive" as Data Scientist is to ________________
A. "Communicative and Collaborative"
B. "Introverted and Technical"
C. "Logical and Steadfast"
D. "Independent and Intelligent"
What describes the use of UNION clause in a SQL statement?
A. Operates on queries and potentially increases the number of rows
B. Operates on queries and potentially decreases the number of rows
C. Operates on tables and potentially decreases the number of columns
D. Operates on both tables and queries and potentially increases both the number of rows and columns
What is a property of window functions in SQL commands?
A. They can be used to calculate moving averages over various intervals.
B. They group rows into a single output row.
C. They can be used between the keywords FROM and WHERE in a SELECT command.
D. They don't require ordering of data within a window.
Refer to the Exhibit.
In the Exhibit. For effective visualization, what is the chart's primary flaw?
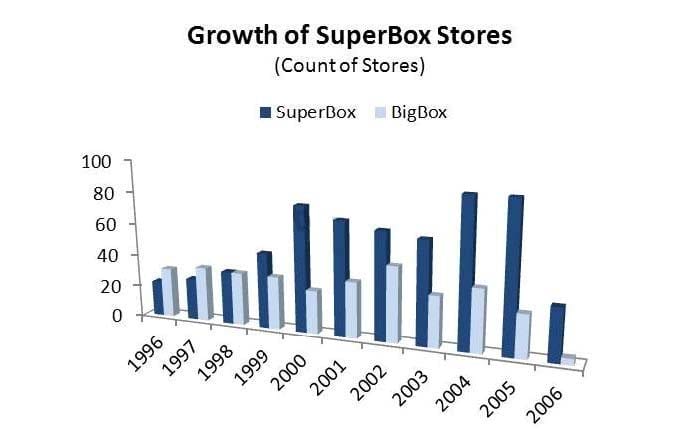
A. The use of 3 dimensions.
B. The slanting of axis labels.
C. The location of the legend.
D. The order of the columns.
Refer to the exhibit.
What provides the decision tree for predicting whether or not someone is a good or bad credit risk. What
would be the assigned probability, p(good), of a single male with no known savings?
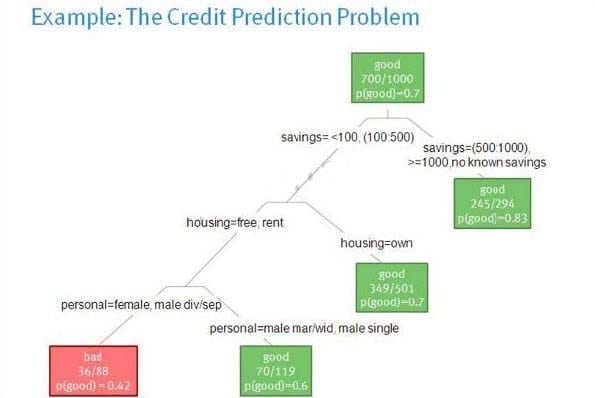
A. 0.83
B. 0
C. 0.498
D. 0.6
Refer to the exhibit.
The graph represents an ROC space with four classifiers labelled A through D. Which point in the graph
represents a perfect classification?
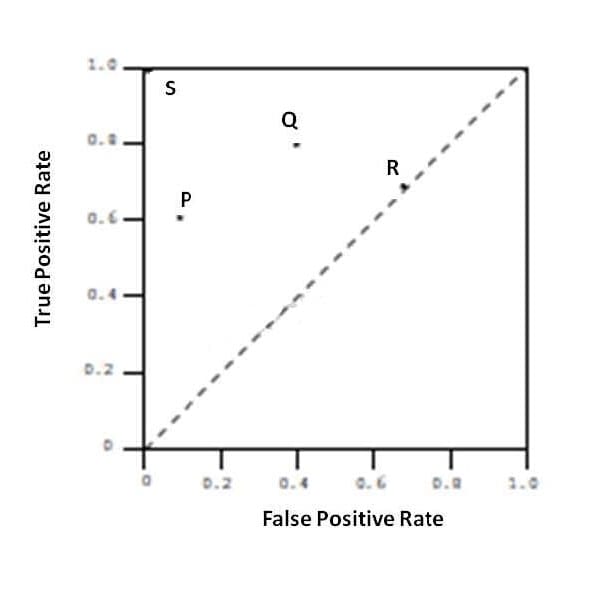
A. S
B. P
C. Q
D. R

Home | Contact Us | About Us | FAQ | Guarantee & Policy | Privacy & Policy | Terms & Conditions | How to buy
Copyright © 2026 pass4itsure.com. All Rights Reserved