CSSGB Online Practice Questions and Answers
Use Minitab to construct a run chart and a histogram from this data set.
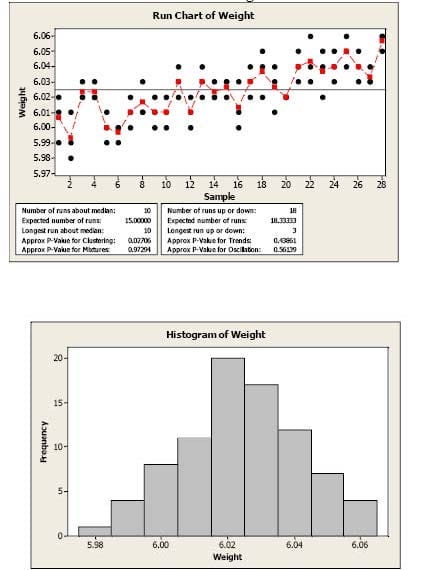
Interpret the charts. What conclusions about the distribution of the weights can you reach based on these charts?
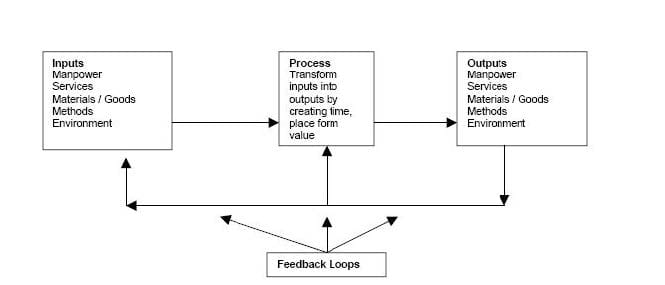
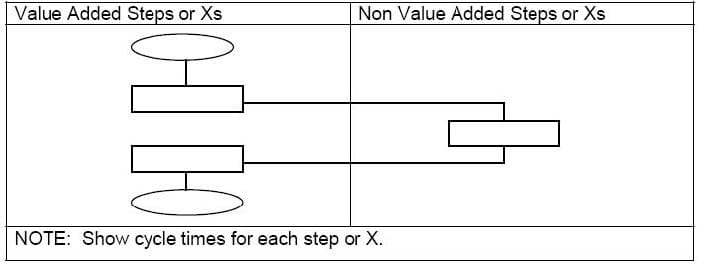
Explain how flowcharts can be constructed to identify and highlight the non-value added steps in a process.
In a full factorial experimental design, factors A and B are both tested at 4 levels.
How many experiments are conducted?
A. 8
B. 9
C. 12
D. 16
The charting of a data set in which most of the data points are concentrated around the average (mean), thus forming a bell-shaped curve.
A. Pareto Chart
B. Normal Distribution
C. Standard Deviation D. Scatter Diagram
A methodology that provides businesses with the tools to improve the capability of their business processes.
A. Design of Experiments
B. Benchmarking
C. Six Sigma
D. Failure Mode and Effects Analysis
Which of the following is the key objective of a six sigma project?
A. Developing detailed control charts for critical processes
B. Developing a matrix to understand the how's and what's of a problem process
C. Reducing variation in critical processes
D. Reducing investment costs while improving output quality
Which of following six sigma role is most likely to define objectives for an improvement team?
A. Leader
B. Facilitator
C. Sponsor
D. Member
Fractional Factorial designs for an experimental approach are used when ____________ about the multiple metric interaction in a process.
A. Much is known
B. Little is known
C. We don't care
D. Data exists
Due to excessive pollution, GREEN Solutions Inc. is considering subsidizing public transportation to work for its employees. According to the manager it takes an average weekday commute of 39 minutes with a Standard Deviation of 7 minutes for the employees to get to work while they use their personal vehicles for their office commute while the management set a policy of not more than 40 minutes for their daily one-way commute. A survey conducted one day on 70 employees showed an average of 34 minutes commuting time using the metro public transportation system with a Standard Deviation of 21 minutes. Assuming a Normal Distribution for the commute times by either personal or public transportation, which of these is true?
A. The probability that they would arrive on time using personal vehicles is much higher than using the metro public transportation system (MPTS)
B. The probability that they would arrive on time using the MPTS is much higher than using their personal vehicles
C. The two probabilities are about the same excepting in one case the consistency is higher than the other
D. We need to compile more data around weekends to incorporate for traffic differences
E. When Standard Deviation is higher the probability goes down and so the MPTS is worse

Home | Contact Us | About Us | FAQ | Guarantee & Policy | Privacy & Policy | Terms & Conditions | How to buy
Copyright © 2026 pass4itsure.com. All Rights Reserved