CSSBB Online Practice Questions and Answers
On a _________________ one can see a pattern from the graphed points such that conclusions can be drawn about the largest family of Variation.
A. Multi-Vari Chart
B. Weighted Scale
C. X-Y Matrix
D. Poisson Chart
If an experiment has 5 factors and no replicates for a 2-level Experimental Design with 16 experimental runs which statement(s) are correct? (Note: There are 3 correct answers).
A. The Main Effects for the 5 factors are not aliased or confounded but the 2-way interactions are confounded with the 3-way interactions
B. The Main Effects are confounded with only 4-way interactions
C. The Experimental Design is half-fractional
D. The experiment has 8 experimental runs with the first factor at the high level
E. The experiment has only 4 experimental runs with the 5th factor at the high level
Which of the items listed do not define what an X-Y Diagram is?
A. Created for every project
B. Based on team's collective opinions
C. Updated whenever a parameter is changed
D. Used to show each step in a process
E. A living document throughout project lifecycle
If a process has subgroups for Variable data and the process runs for a long period of time, then the best pair of SPC Charts to use would be an Xbar and _________.
A. NP Chart
B. Individuals Chart
C. R Chart
D. C Chart
A valid Multiple Linear Regression (MLR) is characterized by all of these except _______________________.
A. It is an assumption that the X's (inputs) are not correlated to each other
B. The X's (inputs) are assumed to be independent of each other
C. MLR is conducted based on a deliberate form of experimentation
D. The Residuals from MLR analysis have to be Normally Distributed
An operator is measuring the distance between two points. Which is most likely to be influenced by the operator?
A. Precision of the measurement
B. Accuracy of the measurement
C. Calibration of the instrument
D. All of these answers are correct
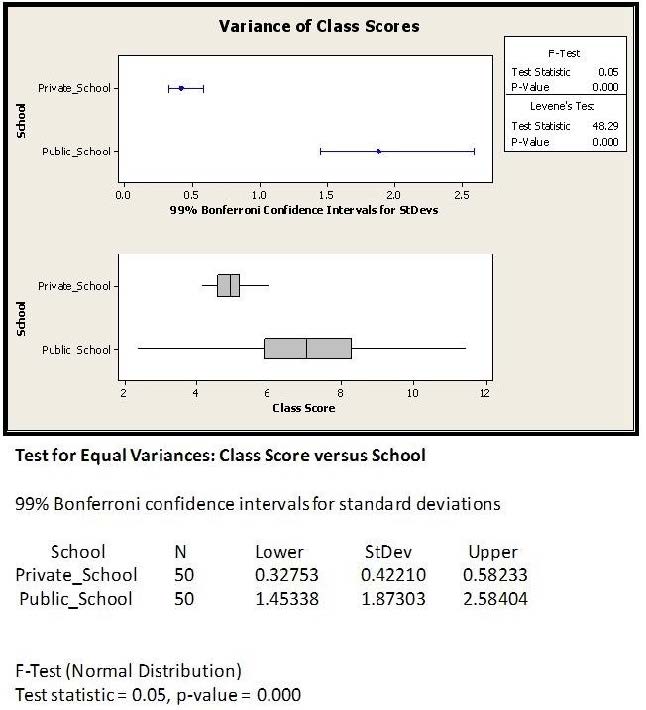
From the variance F-test shown above, which of these conclusions is/are valid?

A. The variance between the class score distribution is significantly different
B. The variance between the class score distribution is not significantly different
C. This test applies only to Normal Distributed data at 99 % confidence
D. This test applies only to Non-normal Data at 99 % confidence
E. There are not enough data points to make any statistical conclusions
In a Fishbone Diagram the 6M's stand for Methods, Measurements, Machine, Man, Mother Nature and ____________ .
A. Management
B. Merger
C. Materials
D. Medical
To properly analyze the variables impacting the output of a process we need to collect data that represents at least 80% of the variation in the process and assure ourselves we are collecting data from all three types of variation which are _______________.
A. Within, Between and Temporal
B. Within, Between and Temporary
C. Without, Above and Below
D. Induced, Natural and Unavoidable
A Belt working in a supply chain environment has to make a decision to change suppliers of critical raw materials for a new product upgrade. The purchasing manager is depending on the Belt's effort requiring that the average cost of an internal critical raw material component be less than or equal to $4,200 in order to stay within budget. Using a sample of 35 first article components, a Mean of the new product upgrade price of $4,060, and a Standard Deviation of $98 was estimated. In order to increase the Long Term Z value to 4, what is the maximum long term variation in pricing the Belt can accept for his upgraded critical raw material component?
A. $20
B. $35
C. $70 D. $110

