CLSSBB Online Practice Questions and Answers
The primary metric for a project is reduced cost for process A . Baseline data might include:
A. current maintenance costs
B. current selling price for the products or services output by process A
C. current suggestions from stakeholders of process A
D. all the above
E. none of the above
Find the value of (4) in the ANOVA table. Assume:
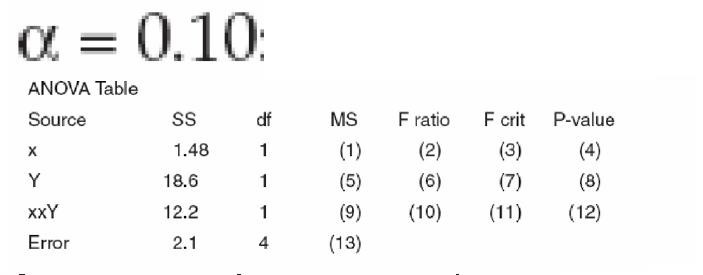
A. 16.4
B. 3.2
C. 18.6
D. 23.2
E. 4.54
F. 12.2
G. 0.525
H. 2.82
I. 1.48
J. 35.4
K. 0.10 L. 0.05 M. 0.01 N. 0.005 O. 0
What dollar amount of savings would a project show if it reduced your outstanding Accounts Receivable by $1.4 million dollars to $5.3 million total and your organization's marginal cost of capital was 6.2%?
A. $43,400
B. $86,800
C. $117,500
D. $328,600
Which of the items listed do not define what an X-Y Diagram is?
A. Created for every project
B. Based on team's collective opinions
C. Updated whenever a parameter is changed
D. Used to show each step in a process
E. A living document throughout project lifecycle
The relationship between a response variable and one or more independent variables is investigated and modeled by use of which of these?
A. X-Y Matrix
B. Baldridge Assessment
C. Critical X's Definition
D. Analysis of Variance (ANOVA)
Which of these graphical presentations displays the values of each individual reading?
A. Histogram
B. Box Plot
C. Stem and Leaf Plot
D. X-Y Diagram
Which of these might contribute to similar distributions having Unequal Variance?
A. Extreme tails
B. Outliers
C. Multiple Modes
D. All of the above
What conclusion is most correct about the Experimental Design shown here with the response in the far right column?
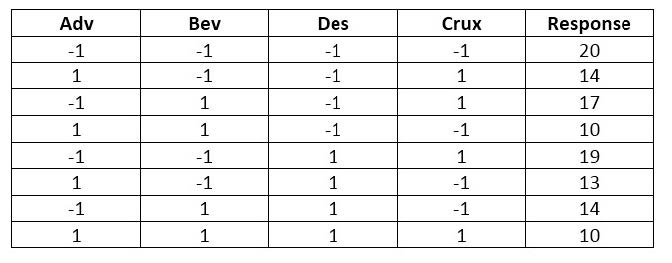
A. No factor has enough statistical confidence greater than 95% to have an impact on the response rate
B. Constant, Adv and Bev are the only factors statistically affecting the response rate with 95% confidence or more
C. If the Adv is increased from the low level to the high level, the response rate increases
D. The response level is statistically concluded to only need the Adv and Bev factors set at the low level to get the largest response rate
E. This design does not have enough experimental runs to conclude anything as evidenced by the lack of P-values in the MINITABTM output
Which of the following techniques is NOT effective when a team leader is giving feedback to the team?
A. Describing the behavior in context
B. Describing the reasons for giving feedback
C. Giving feedback when it is convenient
D. Providing actionable guidance
All of the following experimental designs can be used to investigate interactions EXCEPT
A. half-fraction
B. half-fraction with replication
C. full-factorial with replication
D. saturated screening with replication

Home | Contact Us | About Us | FAQ | Guarantee & Policy | Privacy & Policy | Terms & Conditions | How to buy
Copyright © 2026 pass4itsure.com. All Rights Reserved